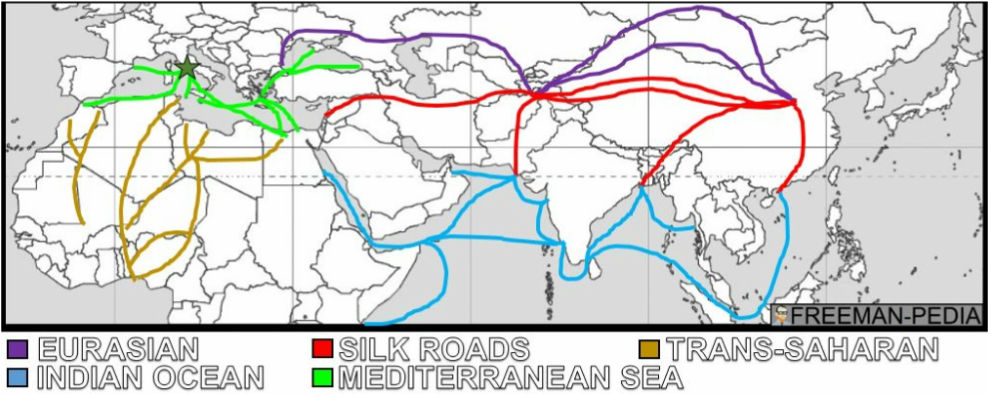
This map depicts the various trade routes that were used during the Early Modern Era, which include the Silk Roads, Trans-Saharan, Mediterranean Sea, and Indian Ocean.. Unlike the Post-Classical Period, more oversea trade occurred, in part facilitated by new technologies such as caravel ships and the magnetic compass. The map also indicates that although a more global trade network resulted from improved technology, which allowed for oversea travel, and the incorporation of the Americas, land trade routes continued to remain a dominant source of economic prosperity and commercial relationships. This global trade network that was established during the Early Modern Era facilitated economic relationships and fostered cultural diffusion from different societies. All in all, the development of new trade routes other than the Silk Roads, which had been the primary trade route earlier, contributed to the beginning of globalization.
http://www.freeman-pedia.com/earlymodern/
http://www.freeman-pedia.com/earlymodern/
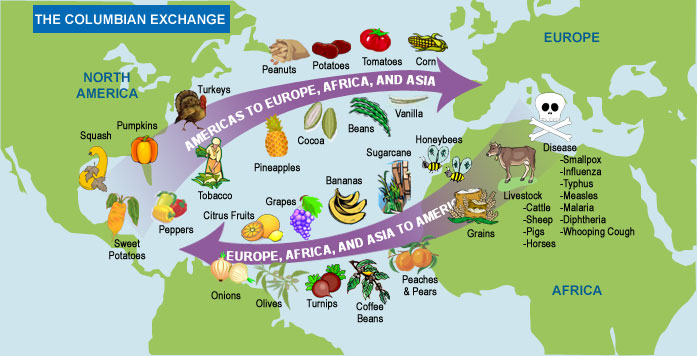
This map is important because it shows that the New and Old World were both active members of the Columbian exchange at this time period. It indicates that vegetables and fruit such as olives, onions, turnips, pears, and peaches were exchanged for potatoes, tomatoes, corn, squash pumpkin, and pineapple from the Americas. Furthermore, livestock such as cattle, pigs, and horses were imported from Europe. This would greatly affect the ecosystem of the Americas, as it produced significant environmental effects on the land. In addition, this map shows that disease such as the measles, smallpox, and influenza also spread along with crops in the Columbian Exchange, and this decimated the native populations. The extent of agricultural exchange also indicates that the Columbian Exchanges also contributed to dramatic population increases in Europe, especially due to the potato.
Worldhistory1stexam.weebly.com
Worldhistory1stexam.weebly.com
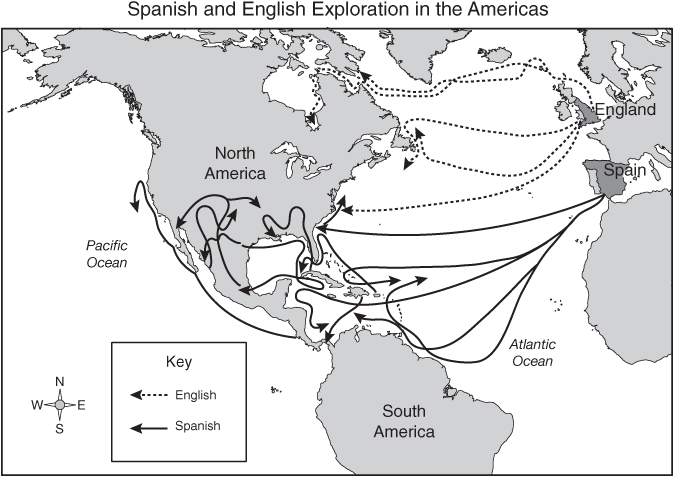
This map shows the extent to which the English and the Spanish explored the New World. The different types of lines show the viewer that Spain had established more colonies when compared to England, and this can be attributed to the fact that Spain had found the Americas earlier, and this provided them an advantage over England. This map also indicates that Central America and South America were mainly controlled by Spain, while what is today the United States of America and Canada were controlled by England. Because this picture is centered on the Americas, it is safe to conclude that exploration was mainly centered in the New World between 1450 to 1750.
Historywithsanders.blogspot.com
Historywithsanders.blogspot.com
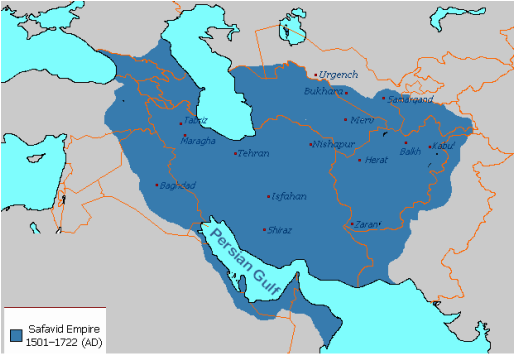
This image shows the size of the Safavid dynasty. At its height, it covered parts of Turkey and Georgia, and all of Iran. Due to this size, the Safavids were able to unite the cultures of many lands. This also indicates that because of the conversion of many people to Shi'a Islam as a result of the Safavid brotherhood launching a jihad (Islamic holy war) in the 15th century, the common bonding enabled political and commercial unity, and this contributed to the size and eminence of the Safavid Dynasty in the Early Modern Era.
www.forumbiodiversity.com
www.forumbiodiversity.com
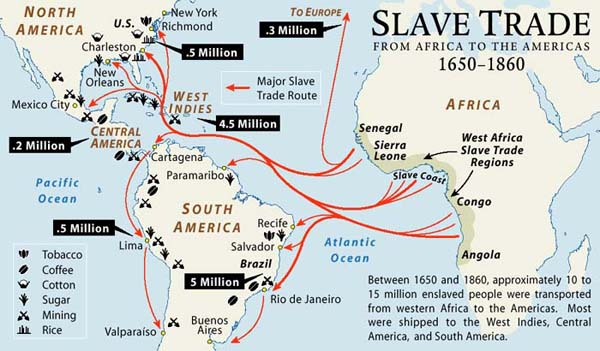
This map shows that most of the slaves from Africa went to South America, where they were mainly used in the mining for gold and production of sugar on plantations. Because disease decimated a large number of native populations in South America, slaves gradually began to be brought from Africa to work in the Americas, thus filling up the slaves' position. This can be correlated to the major factors contributing to expansion in the first place: the desire to gain more wealth and large amounts of cash crops at a low price. This map indicates the level to which Europe was able to monopolize and exploit the natural resources available in Africa and the Americas for its own benefit.
www.slaverysite.com
www.slaverysite.com
